The various types of charts available in Stocko Trader are:
Bar Chart
This chart type is the most common method for displaying data used in analysis. It shows the open, high, low, and close prices for the time increment represented by each bar.

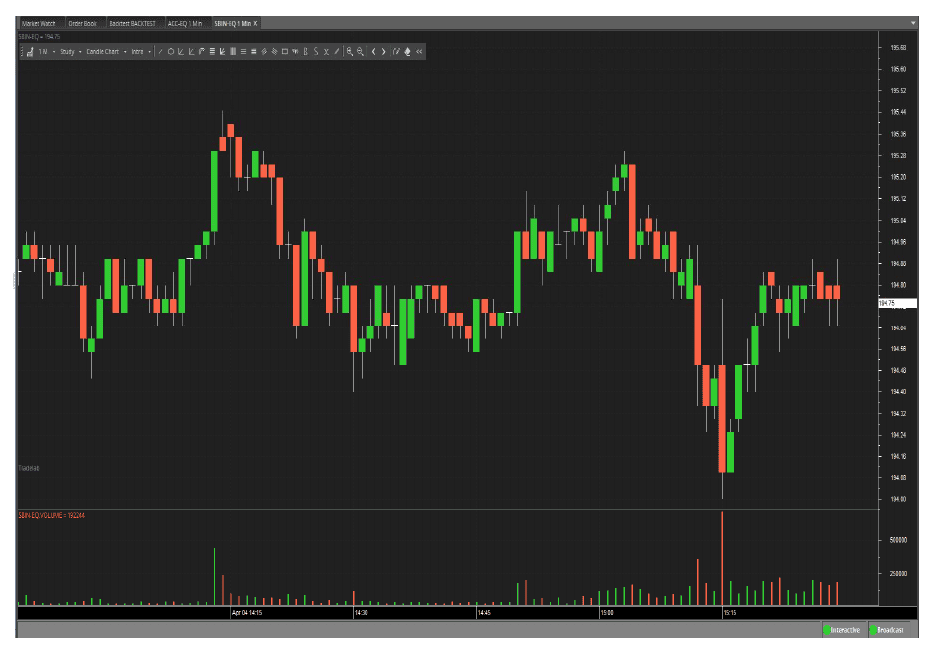
Candle Chart
This chart type uses the same price data as regular bar charts, with each candlestick representing the open, high, low, and close prices for the given time period.
- The thick part, known as the real body, represents the range between the opening and closing prices.
- The long thin lines, referred to as shadows, wicks, or tails, represent the range of price movement during the time interval covered by the bar.
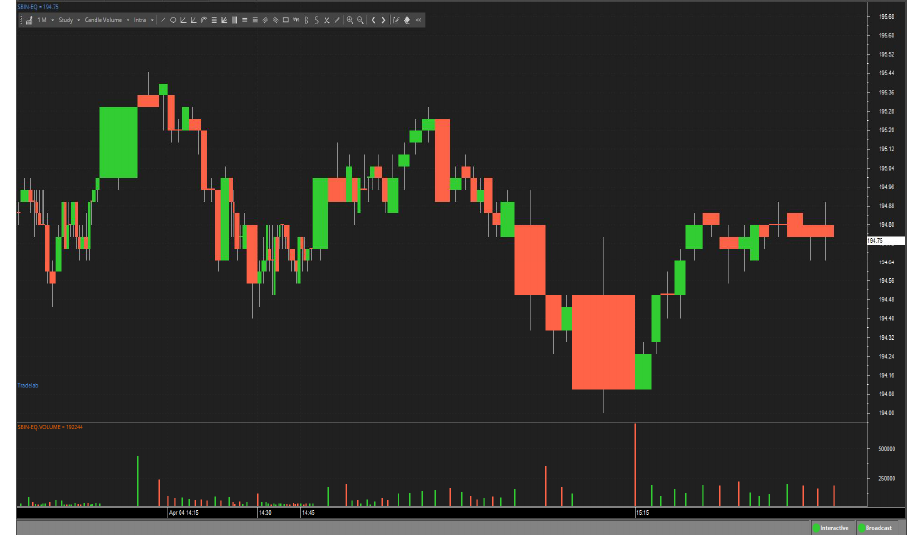
Candle Volume
As its name implies, Candle Volume Charts merge volume into candlesticks, allowing traders and analysts to assess both price action and volume at a glance.
These charts use candlestick ticks to display the open, close, high, and low prices for each time period, providing a comprehensive view of market activity.
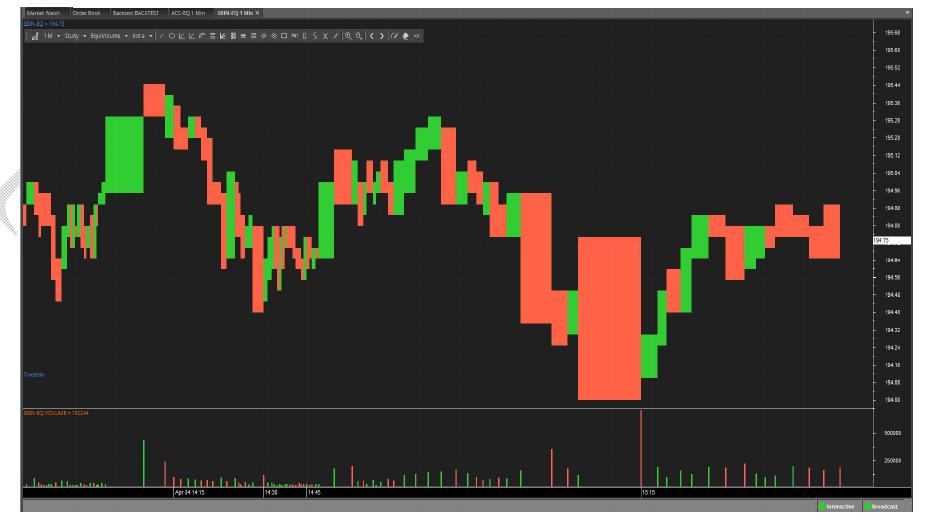
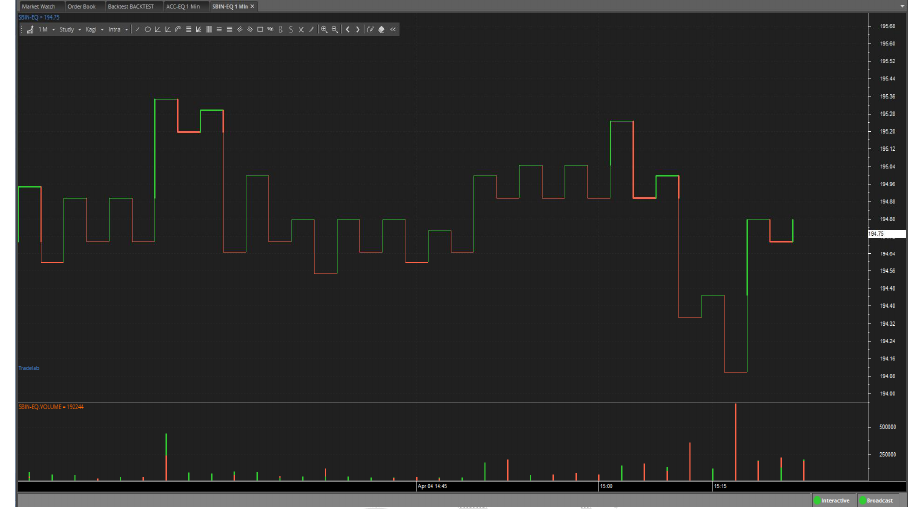
Equi Volume
An Equi Volume Chart is a price plot that incorporates volume into each time period. These charts are similar in appearance to candlestick charts, but instead of candlestick ticks, they use Equi Volume boxes, which can be either square or rectangular.
Equi Volume Shadow
The Equi Volume Shadow measures the relationship between price, volume, and shadow within a two-dimensional framework.
- Price is represented on the vertical axis, while volume is shown on the horizontal axis.
- The chart combines price and volume in a two-dimensional box.
- The top line of the box represents the high price for the period, and the bottom line represents the low price for the period.
- The width of the box indicates the volume for that time period.
- The shadow, an empty region within the box, is determined by the difference between the opening price and either the high or low value, depending on whether the price closed lower or higher than the open during that interval.

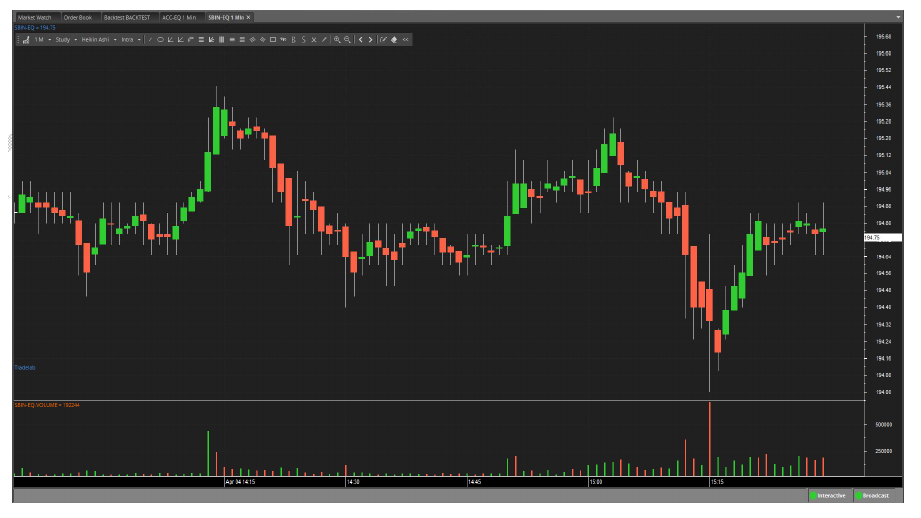
Heikin Ashi
Heiken-Ashi means “average bar” in Japanese. The open, high, low, and close prices of Heiken-Ashi (HA) candle ticks are not the actual market prices; instead, they are calculated by averaging the values of the previous bar. This method helps smooth out random volatility, providing a clearer view of market trends.
Kagi
This chart type appears as a continuous line that changes direction and alternates between thin and bold. The direction changes when the price moves beyond a predefined threshold. Additionally, the line switches between thin and bold when the price movement bypasses the last horizontal line.
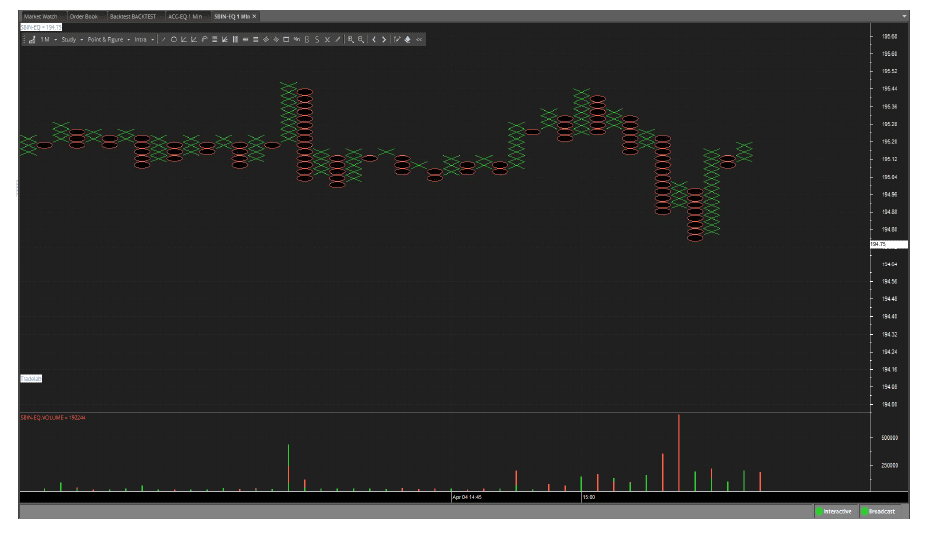
Point & Figure
This chart type plots only price movements without considering time. A column of X’s is plotted as the price rises, while a column of O’s is plotted as the price drops.
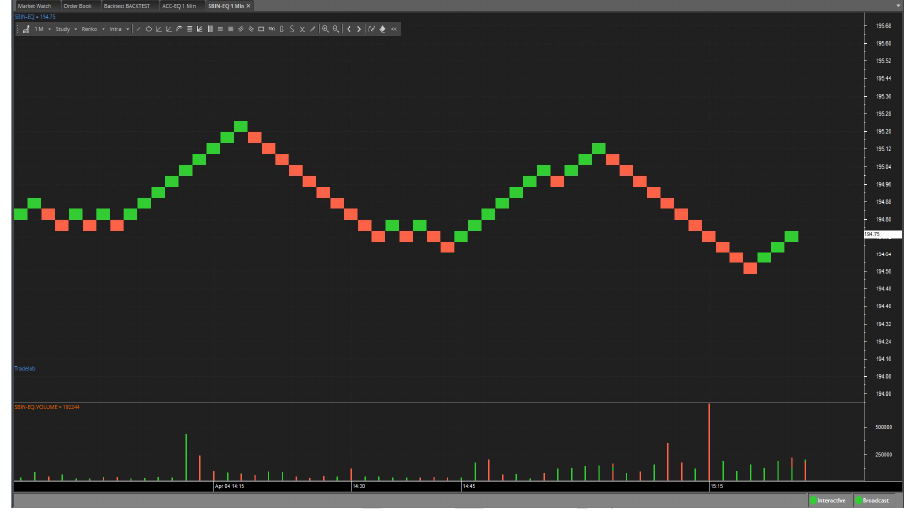
Renko
This chart type plots only price movements without considering time or volume. It is constructed using price ticks and appears as bricks stacked in adjacent columns. A new brick is drawn each time the price moves beyond the top or bottom of a previously predefined price range.
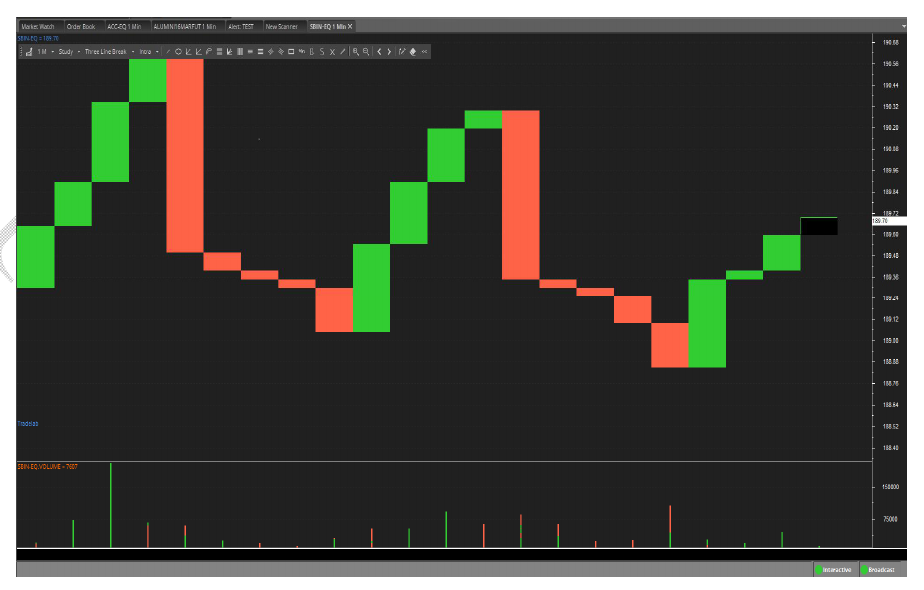
Three Line Break
This chart type plots only price movements without considering time or volume. It displays a series of vertical boxes that represent changes in price, with each box corresponding to a predefined price movement.
Stocko Trading Tools: Elevate Your Trades